
Uncharted Part 2 – Waterfall
Almost 20 million copies have been sold of the game series Uncharted which is the eponym of our article series. What is more important though is a program which has bit more moderate sales figures. The German-developed think-cell is the best friend of every consultant. But why is that?

First of all, this tiny program outperforms Excel by far. The secret is that we can make charts really fast with it. For the skeptical, here is this video. Speed is complemented by very useful extas such the ‘CAGR arrow’. When working with historical trends we often have to calculate the compound average growth rate (CAGR) which think-cell simply does for us and with a simple click it inserts the CAGR value in our graph, supplementing the trend with an indicative arrow. And this is just one of the several useful, time-saving features.
Although the subject of this article is not this feature but another one of think-cell’s big hits. The program contains some chart types that have been left out of Excel. One of them is the waterfall, which can be useful in consulting and case solving as well. The next figure shows a typical way of using this chart:
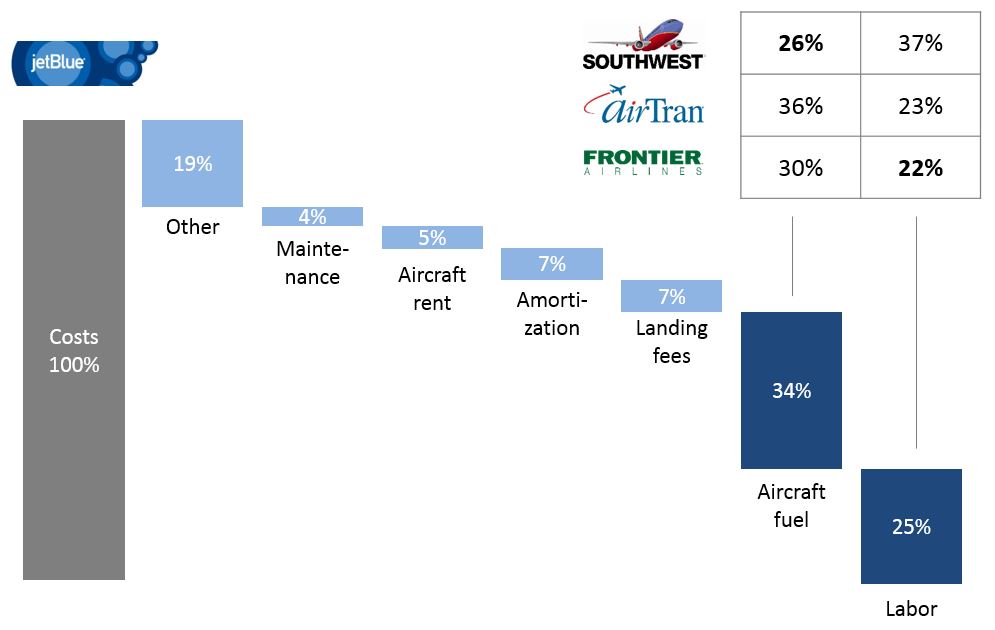
That’s right, costs can be shown in other ways besides pie charts. Waterfall can be a good pick from an aesthetic perspective, moreover such graph – due to the fact that it is relatively unknown – can grab people’s attention. It is also practical to use the waterfall as we can easily pick out the significant items that can be compared with competitors’ respective data.
Of course, the waterfall can be used in other situations as well. In fact its main strength comes out in situations where we want to illustrate changes with different presages. Such situation can be the change in inventories or performance.
In the next part of our article series we are going to write about another chart type, the variwide which is also very useful in case solving. In the meantime, chart up!
Disclaimer: The waterfall shown in the picture was not made with think-cell. Really professional waterfall charts can be found here.

